Data Analytics - Running data analytics on application logs and events using Elasticsearch, Logstash and Kibana
We will start with Basic Configuration on Elasticsearch, Logstash, Kibana and Filebeat and then run all the services and will create application events and logs structure, generate events and finally run data analytics on application events and logs in Kibana Dashboard.
Installations
1. Basic configuration
I hope by now you are have installed Elasticsearch, Logstash, Kibana and Filebeat on your system. Now, Let's do few basic configurations required to be able to run analytics on application events and logs.
1.\1. Elasticsearch
Open elasticsearch.yml file in [ELASTICSEARCH_INSTLLATION_DIR]/config folder and below add properties to it.
cluster.name: gauravbytes-event-analyzer
node.name: node-1
Cluster name is used by Elasticsearch node to form a cluster. Node name within cluster need to be unique. We are running only single instance of Elasticsearch on our local machine. But, in production grade setup there will be master nodes, data nodes and client nodes that you will be configuring as per your requirements.
1.2.1. Logstash
Open logstash.yml file in [LOGSTASH_INSTALLATION_DIR]/config folder and add below properties to it.
node.name: gauravbytes-logstash
path.data: [MOUNTED_HDD_LOCATION]
config.reload.automatic: true
config.reload.interval: 30s
1.2.2. Creating logstash pipeline for parsing application events and logs
There are three parts in pipeline. i.e. input, filter and output. Below the pipeline conf for parsing application event and logs.
input {
    beats {
        port => "5044"
    }
}

filter {

    grok {
        match => {"message" => "\[%{TIMESTAMP_ISO8601:loggerTime}\] *%{LOGLEVEL:level} *%{DATA:loggerName} *- (?(.|\r|\n)*)"}
    }

    if ([fields][type] == "appevents") {
        json {
            source => "event"
            target => "appEvent"
        }

        mutate {
            remove_field => "event"
        }

        date {
            match => [ "[appEvent][eventTime]" , "ISO8601" ]
            target => "@timestamp"
        }

        mutate {
            replace => { "[type]" => "app-events" }
        }
    }
    else if ([fields][type] == "businesslogs") {
        mutate {
            replace => { "[type]" => "app-logs" }
        }
    }

    mutate {
        remove_field => "message"
    }
}
output {
    elasticsearch {
        hosts => ["http://localhost:9200"]
        index => "%{type}-%{+YYYY.MM.dd}"
    }
}
In the input section, we are listening on port 5044 for beat (filebeat to send data on this port).
In the output section, we are persisting data in Elasticsearch on an index based on type and date combination.
Let's discuss the filter section in detail.
- We are using grok filter plugin to parse plain lines of text to structured data.
grok {
    match => {"message" => "\[%{TIMESTAMP_ISO8601:loggerTime}\] *%{LOGLEVEL:level} *%{DATA:loggerName} *- (?(.|\r|\n)*)"}
}- We are using json filter plugin to the convert event field to a json object and storing it in appEvent field.
json {
    source => "event"
    target => "appEvent"
}- We are using mutate filter plugin to the remove data we don't require.
mutate {
    remove_field => "event"
}

mutate {
    remove_field => "message"
}- We are using date filter plugin to the parse the
eventTimefromappEventfield to ISO8601 dateformat and then replacing its value with@timestampfield.
date {
    match => [ "[appEvent][eventTime]" , "ISO8601" ]
    target => "@timestamp"
}
1.3. Filebeat
Open the file filebeat.yml in [FILEBEAT_INSTALLATION_DIR] and below configurations.
filebeat.prospectors:
- type: log
  enabled: true
  paths:
    - E:\gauravbytes-log-analyzer\logs\AppEvents.log
  fields:
    type: appevents

- type: log
  enabled: true
  paths:
    - E:\gauravbytes-log-analyzer\logs\GauravBytesLogs.log
  fields:
    type: businesslogs
  multiline.pattern: ^\[
  multiline.negate: true
  multiline.match: after

filebeat.config.modules:
  path: ${path.config}/modules.d/*.yml
  reload.enabled: false
setup.template.settings:
  index.number_of_shards: 3

output.logstash:
  hosts: ["localhost:5044"]
In the above configurations, we are defining two different type of filebeat prospectors; one for application events and the other for application logs. We have also defined that the output should be sent to logstash. There are many other configurations that you can do by referencing filebeat.reference.yml file in the filebeat installation directory.
1.4. Kibana
Open the kibana.yml in [KIBANA_INSTALLATION_DIR]/config folder and add below configuration to it.
elasticsearch.url: "http://localhost:9200"We have only configured Elasticsearch url but you can change Kibana host, port, name and other ssl related configurations.
2. Running ELK stack and Filebeat
//running elasticsearch on windows
\bin\elasticsearch.exe

// running logstash
bin\logstash.bat -f config\gauravbytes-config.conf --config.reload.automatic

//running kibana
bin\kibana.bat

//running filebeat
filebeat.exe -e -c filebeat-test.yml -d "publish"
3. Creating Application Event and Log structure
I have created two classes AppEvent.java and AppLog.java which will capture information related to application events and logs. Below is the structure for both the classes.
public class AppEvent implements BaseEvent<AppEvent> {
    public enum AppEventType {
        LOGIN_SUCCESS, LOGIN_FAILURE, DATA_READ, DATA_WRITE, ERROR;
    }

    private String identifier;
    private String hostAddress;
    private String requestIP;
    private ZonedDateTime eventTime;
    private AppEventType eventType;
    private String apiName;
    private String message;
    private Throwable throwable;
}
public class AppLog implements BaseEvent<AppLog> {
private String apiName;
private String message;
private Throwable throwable;
}4. Generate application events and logs
I have created a sample application to generate dummy application events and logs. You can check out the full project on github. There is a AppEventGenerator.java file. Run this class with system argument -DLOG_PATH=[YOUR_LOG_DIR] to generate dummy events. If your log_path is not same as one defined in the filebeat-test.yml, then copy the log files generated by this project to the location defined in the filebeat-test.yml. You soon see the events and logs got persisted in the Elasticsearch.
5. Running analytics on application events and logs in Kibana dashboard
First, we need to define Index pattern in Kibana to view the application events and logs. Follow step by step guide below to create Index pattern.
- Open Kibana dashboard by opening the url (http://localhost:5601/).
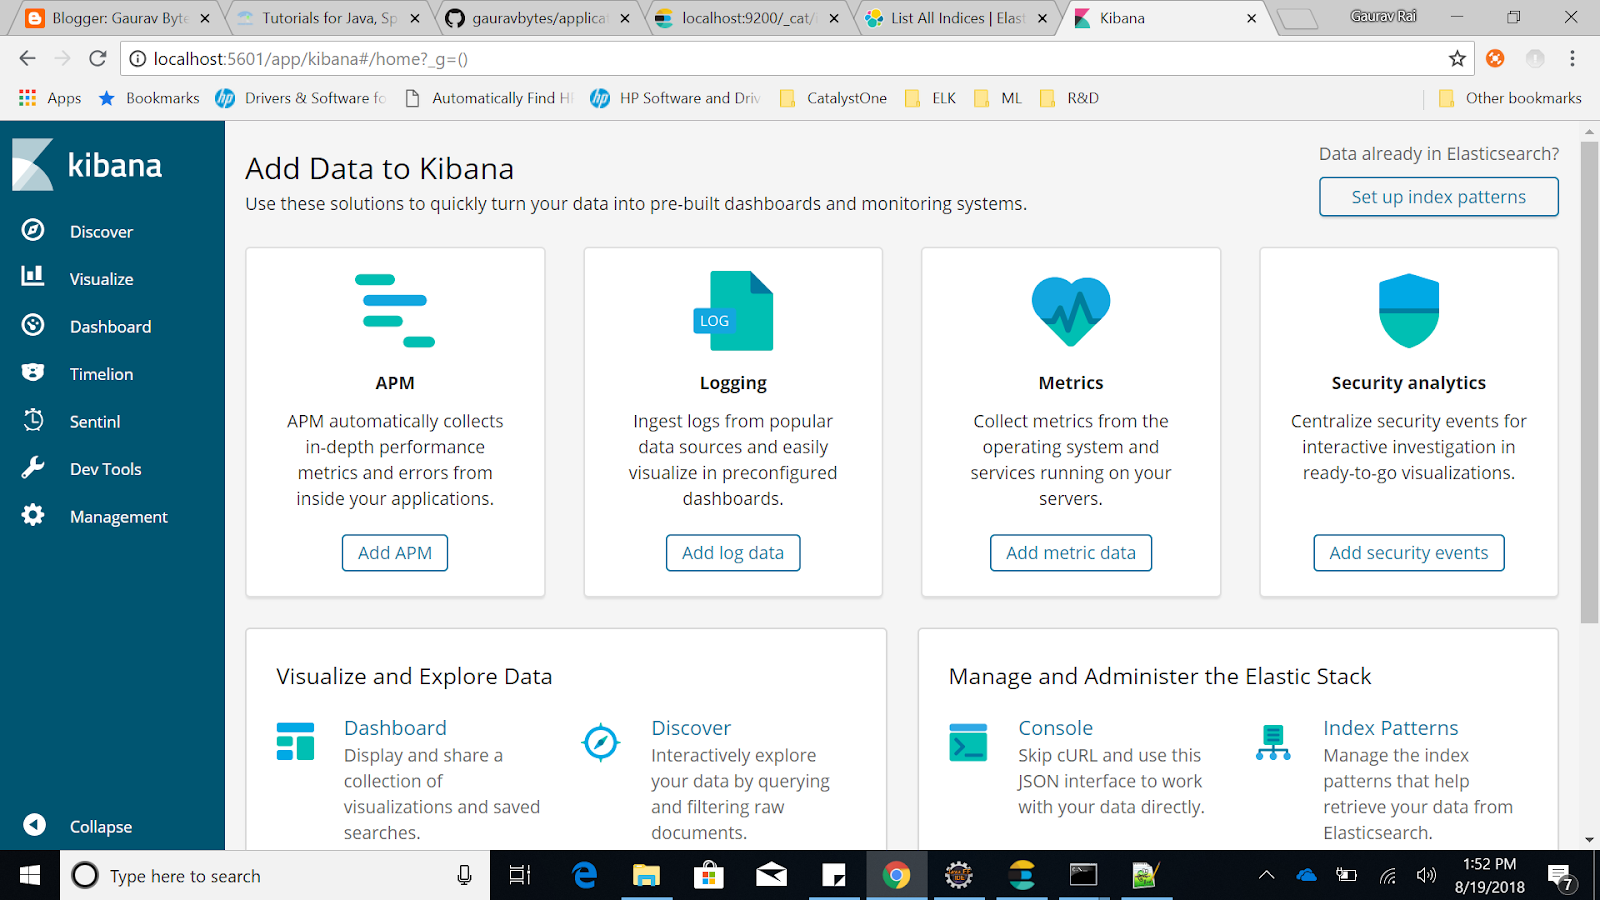
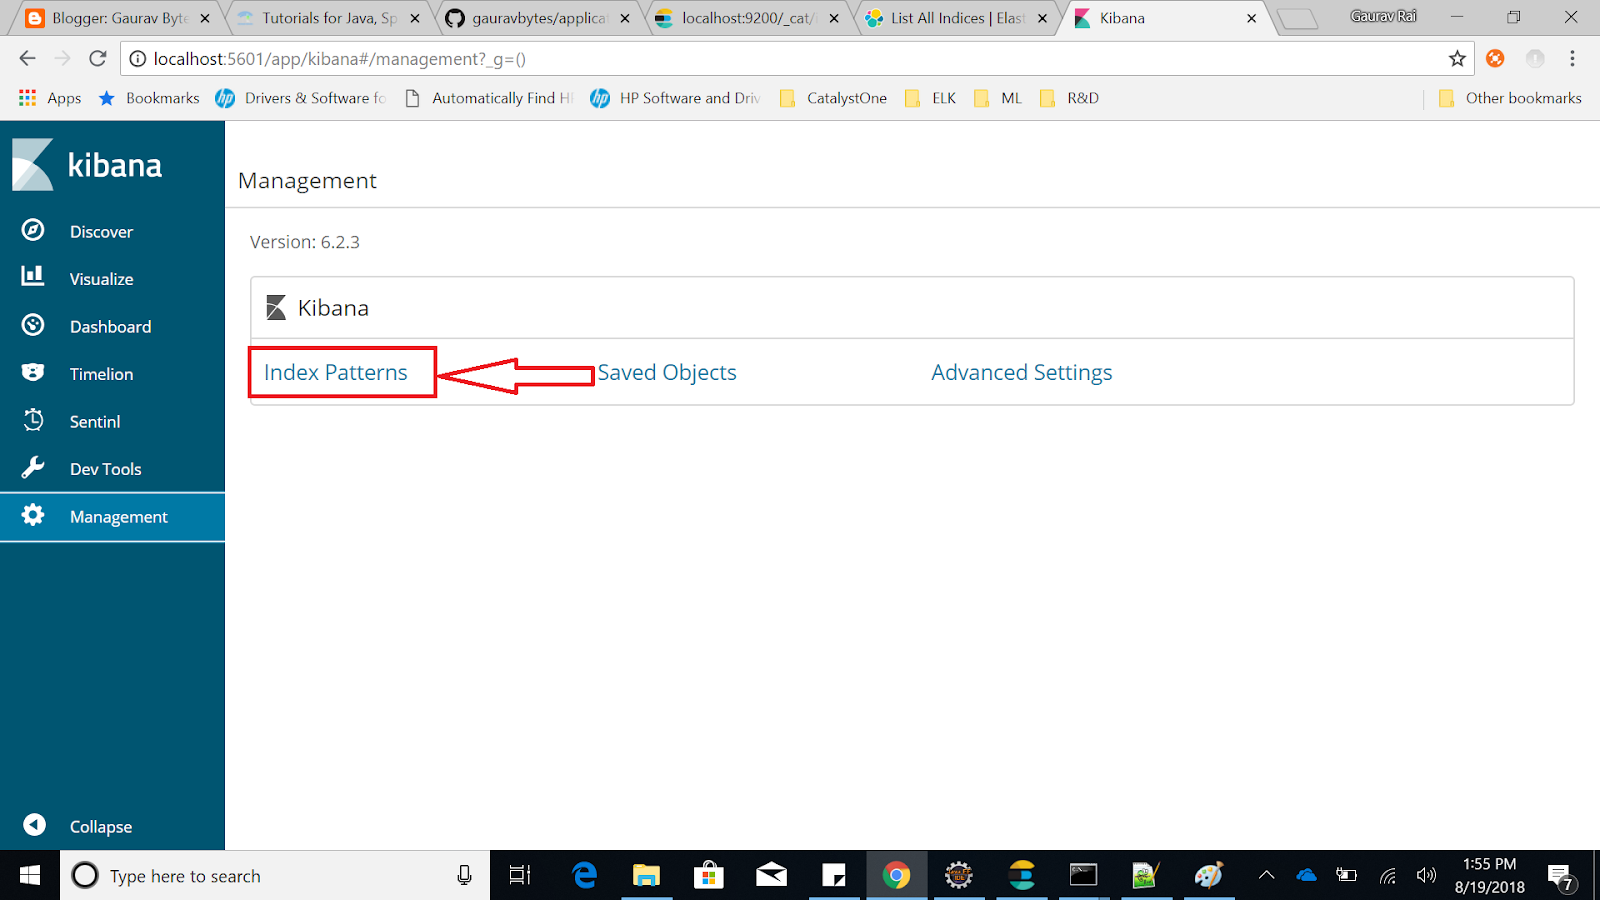
- Go to Management tab. (Left pane, last option)

- Click on Index Patterns link.
- You will see already created index, if any. On the left side, you will see Option to Create Index pattern. Click on it.
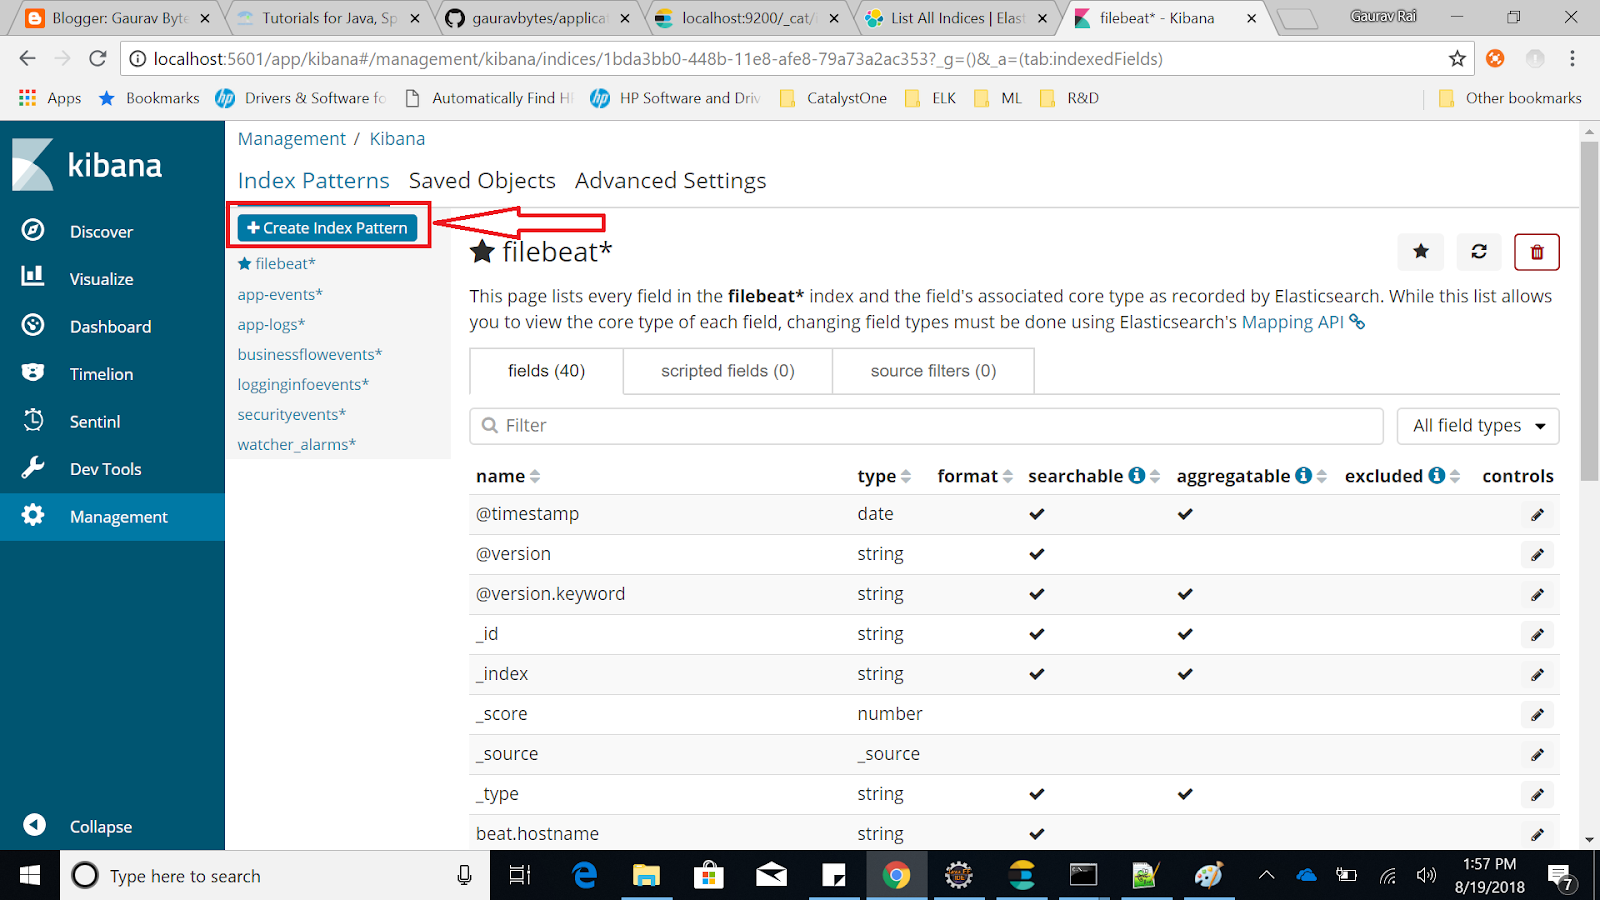
- Now, define index pattern and Click next. Choose time filter field name. I choose
@timestampfield for this. You can select any other timestamp field present in this Index and finally click on Create index pattern button.
6. View Kibana dashboard for analytics
Once Index pattern is created, click on Discover tab on the left pane and select index pattern created by you in the previous steps.
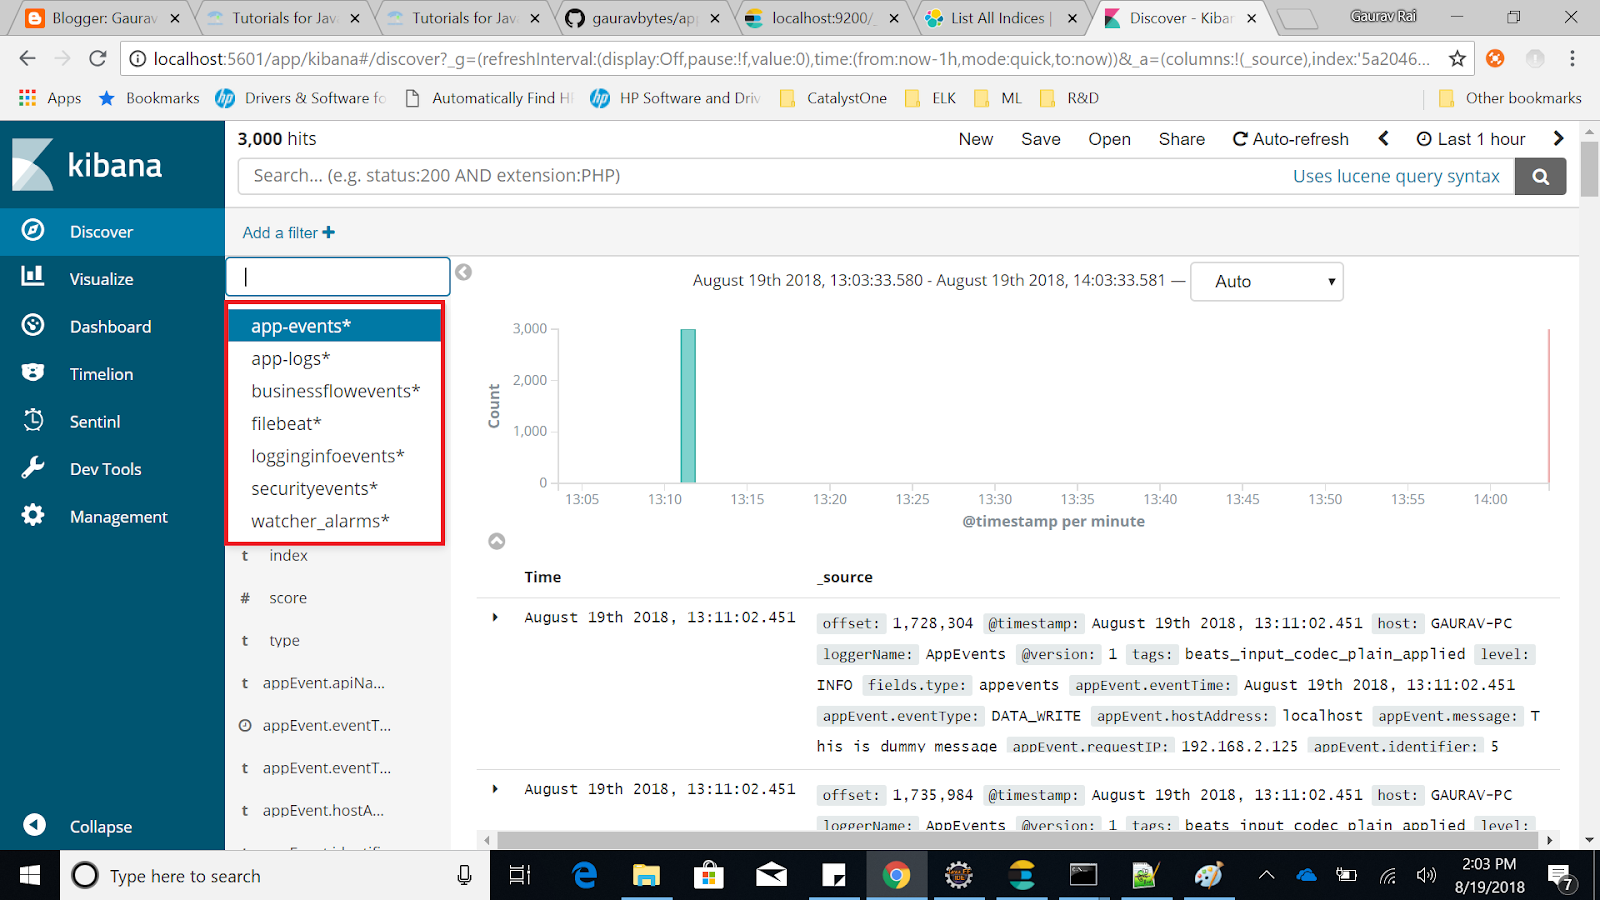
You will see a beautiful GUI with a lot of options to mine the data. On the top most pane, you will see option to Auto refresh and data that you would want to fetch (Last 15 minutes, 30 minutes, 1 hour, 1 day and so on) and it will automatically refresh the dashboard.
The next lane has search box. You can further write queries to have more granular view of the data. It uses Apache Lucene's query syntax.
You can also define filters to have a more granular view of data.
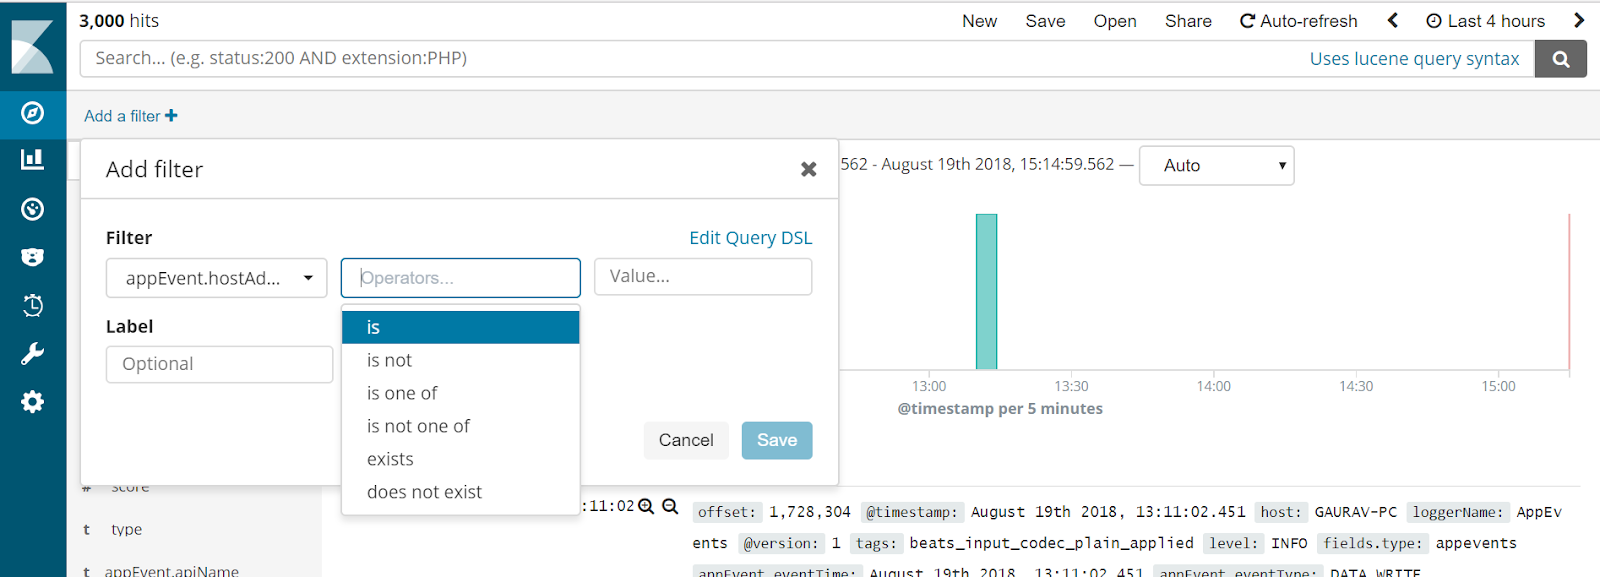
This is how you can run the analytics using ELK on your application events and logs. You can also define complex custom filters, queries and create visualization dashboard. Feel free to explore Kibana's official documentation to use it to its full potential.
Tags: Data Analytics, Elasticsearch, Logstash, Kibana, Filebeat, Configuring Elasticsearch, Configuring Logstash, Configuring Kibana, Configuring Filebeat, Search engine using Elasticsearch, distributed event logs, ELK stack
← Back home