Data Analytics - Watching and Alerting on real time data changes on Elasticsearch index using Kibana and SentiNL
We will start with Why do we need alerting in real-time? and then discuss various available on watching and alerting on Elasticsearch index, installing SentiNL, Configuring SentiNL, Creating watchers and alerting in Kibana dashboard.
Previous post
1. Why do we need to watch and alert on real-time for events?
Few examples of alerting for application events are:
- Same user logged in from different IP addresses.
- Different users logged in from same IP address.
- PermissionFailures in last 15 minutes.
- Particular kind of exception in last 15 minutes/ hour/ day.
2. Various plugins for watching and alerting on Elasticsearch index in Kibana
There are many plugins available for watching and alerting on Elasticsearch index in Kibana like X-Pack, SentiNL.
X-Pack is a paid extension provided by elastic.co which provides security, alerting, monitoring, reporting and graph capabilities.
SentiNL is free extension provided by siren.io which provides alerting and reporting functionality to monitor, notify and report changes in elasticsearch index using standard queries, programmable validators and configurable actions.
We will be using SentiNL for watching and alerting on Elasticsearch index.
3. Installing SentiNL
Prerequisite
For debian, we need
libfontconfigandlibfreetype6libraries, if not installed already are required.sudo apt-get install libfontconfig libfreetype6For centos, we need
fontconfigandfreetypelibraries, if not installed already are required.sudo yum install fontconfig freetype
## Installing SentiNL plugin
/opt/kibana/bin/kibana-plugin --install sentinl -u https://github.com/sirensolutions/sentinl/releases/download/tag-4.6.4-4/sentinl.zip
4. Configuring SentiNL
SentiNL have wide range of actions that you can configure for watchers. You can send an email, integrate with Slack channel or pushapps, send payload to custom webhook. Open kibana.yml file and add below properties for SentiNL. For our example, we will only enable notification through email.
sentinl:
  es:
    host: 'localhost'
    port: 9200
  settings:
    email:
      active: true
      host: "smtp.gmail.com"
      user: "[EMAIL_ID]"
      password: "[PASSWORD]"
      port: 465
      domain: "gmail.com"
      ssl: true
      tls: false
      authentication: ['PLAIN', 'LOGIN', 'CRAM-MD5', 'XOAUTH2']
      timeout: 20000  # mail server connection timeout
      # cert:
      #   key: '/full/sys/path/to/key/file'
      #   cert: '/full/sys/path/to/cert/file'
      #   ca: '/full/sys/path/to/ca/file'
    slack:
      active: false
      username: 'username'
      hook: 'https://hooks.slack.com/services/'
      channel: '#channel'
    webhook:
      active: false
      host: 'localhost'
      port: 9200
      # use_https: false
      # path: ':/'
      # body: '{payload.hits.total}}'
      # method: POST
    report:
      active: false
      executable_path: '/usr/bin/chromium' # path to Chrome v59+ or Chromium v59+
      timeout: 5000
      # authentication:
      #   enabled: true
      #   mode:
      #     searchguard: false
      #     xpack: false
      #     basic: false
      #     custom: true
      #   custom:
      #     username_input_selector: '#username'
      #     password_input_selector: '#password'
      #     login_btn_selector: '#login-btn'
      # file:
      #   pdf:
      #     format: 'A4'
      #     landscape: true
      #   screenshot:
      #     width: 1280
      #     height: 900
    pushapps:
      active: false
      api_key: ''
5. Creating Watchers and Alerting in Kibana
We will be configuring watcher for different users logged in from same IP address and will send e-Mail alerts.
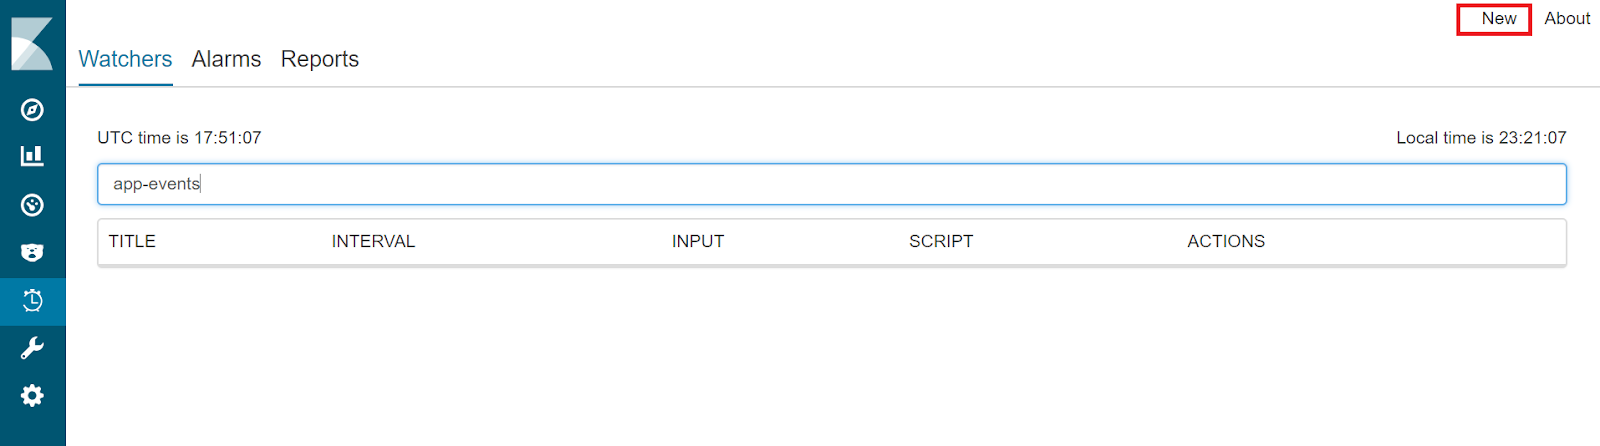
- Open Kibana dashboard on your local machine (Url for Kibana on my local machine is
http://localhost:5601). - Click on SentiNL option in the left nav-pane. You will see a dashboard as below. Click on the New option to create a new watcher.
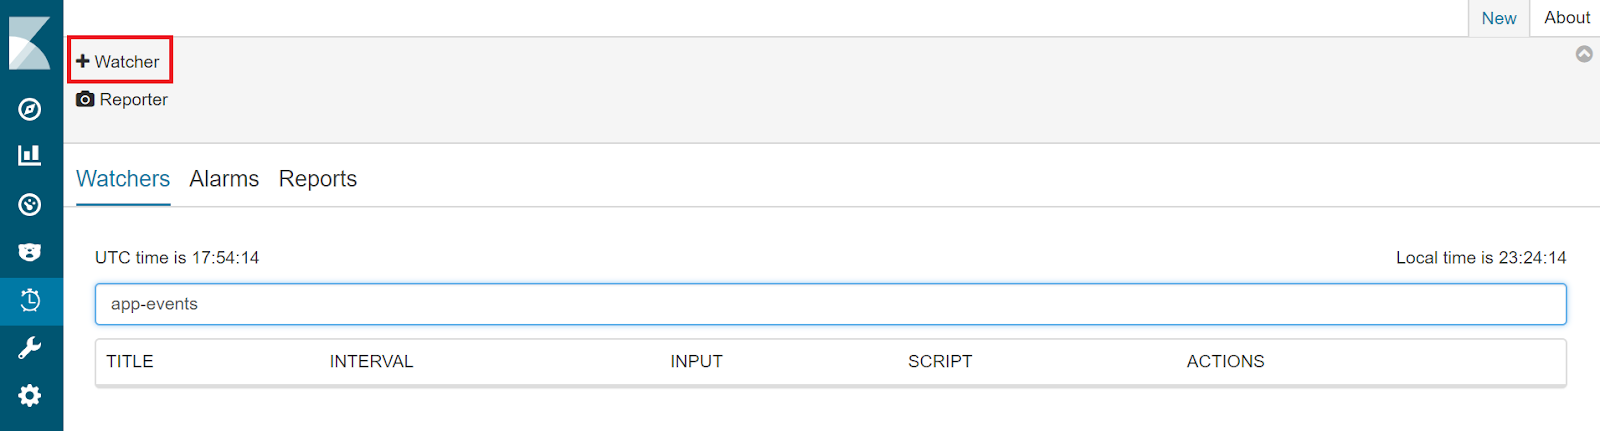
- Click on the Watcher link highlighted as below.
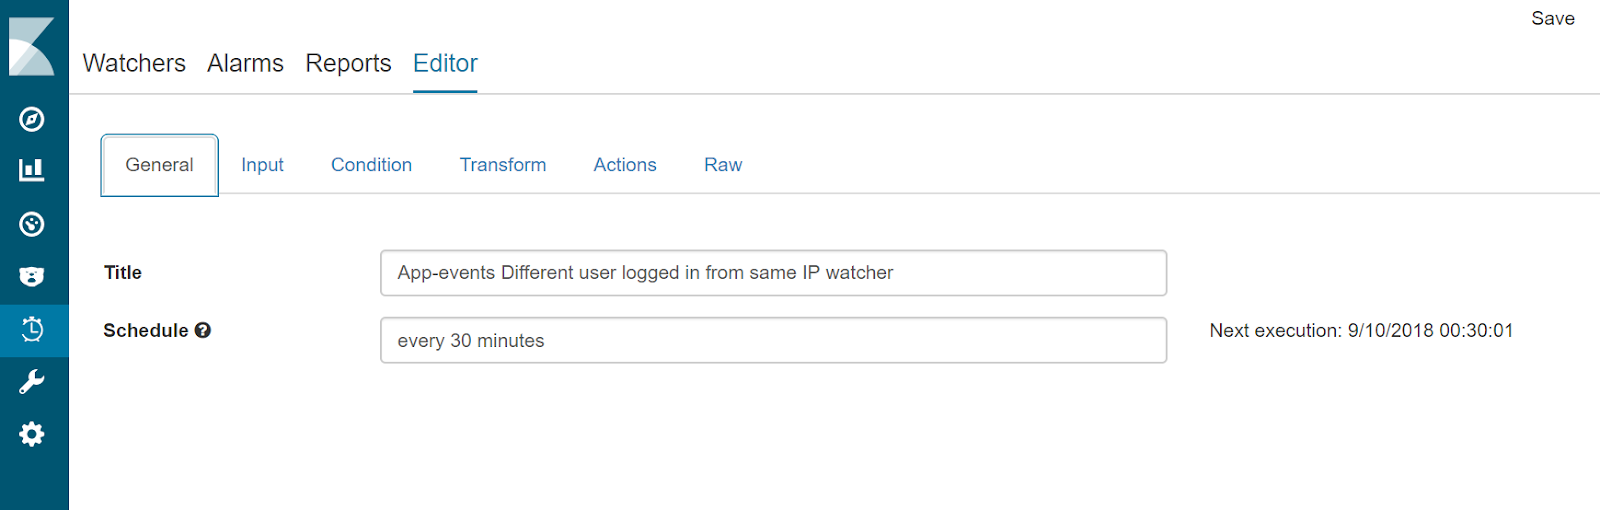
- Enter watcher name and schedule in the General tab.
- Click on Input tab and enter below mentioned query json in the body. You can also give a name to the query and save.
{
  "search": {
    "request": {
      "index": [
        "app-events*"
      ],
      "body": {
        "query": {
          "bool": {
            "filter": [
              {
                "range": {
                  "@timestamp": {
                    "gte": "now-30m"
                  }
                }
              },
              {
                "query_string": {
                  "default_field": "appEvent.eventType",
                  "query": "LOGIN_SUCCESS OR LOGIN_FAILURE"
                }
              }
            ]
          }
        },
        "aggs": {
          "group_by_requestIP": {
            "terms": {
              "field": "appEvent.requestIP.keyword",
              "size": 5
            },
            "aggs": {
              "group_by_identifier": {
                "terms": {
                  "field": "appEvent.identifier.keyword",
                  "size": 5
                },
                "aggs": {
                  "get_latest": {
                    "terms": {
                      "field": "@timestamp",
                      "size": 1,
                      "order": {
                        "_key": "desc"
                      }
                    }
                  }
                }
              }
            }
          }
        }
      }
    }
  }
}- Click on Condition tab and enter below mentioned condition json in the body. You can also give a name to this condition and save.
{
  "script": {
    "script": "var requestIPbuckets = payload.aggregations.group_by_requestIP.buckets; payload.collector = []; requestIPbuckets.filter(function(requestIP) { return requestIP.key; }).forEach(function(requestIP) { var requestIPKey = requestIP.key; var users = requestIP.group_by_identifier.buckets; if (users.length > 1) { users.filter(function(user) { return user.key; }).forEach(function(user) { payload.collector.push({ 'ip': requestIPKey, 'identifier': user.key, 'count': user.doc_count  }); }); }}); payload.collector.length > 0;"
  }
}- Click on Action tab and select email as an action for alerting. Give title, to, from, subject and add below mentioned content in the body of email.
Found {{payload.collector.length}} Events
{{#payload.collector}}
{{#.}}
ip : {{ip}}, identifier: {{identifier}}, count: {{count}}
{{/.}}
{{/payload.collector}}- Save the watcher.
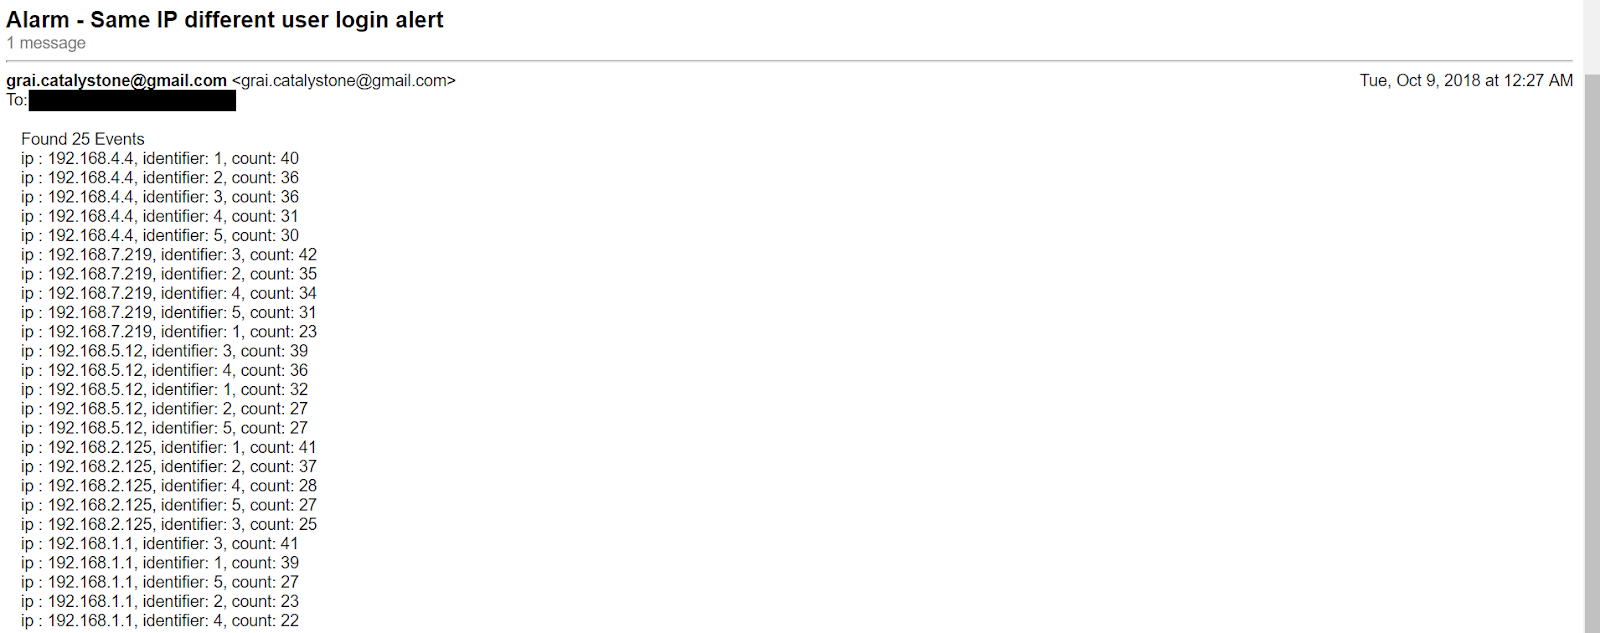
This watcher will run periodically based on the schedule that you have set and if the condition for breach is met, will send an email alert. The configured email looks like below.
This is how you can watch real-time changing data in Elasticsearch index and raise alerts based on the configured conditions.
Tags: Data Analytics, Elasticsearch, Logstash, Kibana, Filebeat, Configuring Elasticsearch, Configuring Logstash, Configuring Kibana, Configuring Filebeat, Search engine using Elasticsearch, distributed event logs, ELK stack, Reporting using SentiNL, SentiNL, SentiNL watchers, Altering on Elasticseach index
← Back home